What is going to happen with information technology? There are a lot of people who wonder about that, who have a significant stake in the answer to that question. There are a lot of answers, too, most of which are simply guesses. Well, there’s no way to make a forecast without an element of judgment, but as I said in a prior blog, it is possible to get solid government statistics on a lot of things, including IT. If you use those statistics you can get a picture of the past and present evolutionary trends, and it’s those trends that create the future.
I’ve been working with US market data from government sources for decades, and recently I’ve been pulling together information on the broad set of changes we’ve seen in those decades, with the goal of determining just where overall IT spending and technology change might be heading. The credibility of this stuff has to be established with past history, so I’ve started back in the early days of IT and taken things forward to today. From today, I’ve tried to model objectively the decisive shifts that past history has offered, and from those to paint a picture of the future.
All of the charts in this blog are based on source data on private fixed asset investment by type, selecting the categories for computers and peripherals, network/communications equipment, and software. Charts showing spending are representing billions of US dollars. Those showing rate of change of spending show the ratio of increase or decrease, so a value of 0.1 means a ten percent increase over the prior year.
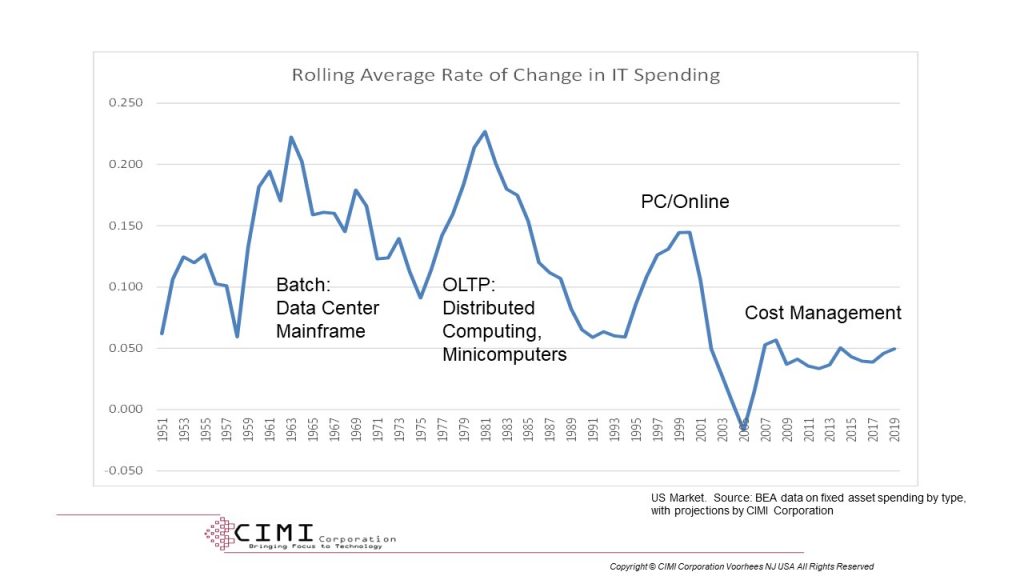
The chart above, which I’ve included in past blogs, shows the broad trends in IT spending in business IT since the dawn of commercial computing. The three cyclical trends in the chart represent periods when a new computing paradigm enhanced business productivity significantly enough to justify boosting spending to accelerate the paradigm’s adoption. This chart, showing the rate of change of IT spending, makes the cyclical trends clearer, and it’s these three cyclical shifts that have combined to drive our current levels of spending. The primary technology changes representing each cycle are noted, and I’ll repeat them in other charts below for reference.
The problem we face in IT is also illustrated in the chart. Since the last cycle crashed with the dot-com crash at the end of the 1990s, we’ve not had another productivity cycle. Why that would be true isn’t obvious from the cyclical chart, so we have to look deeper.
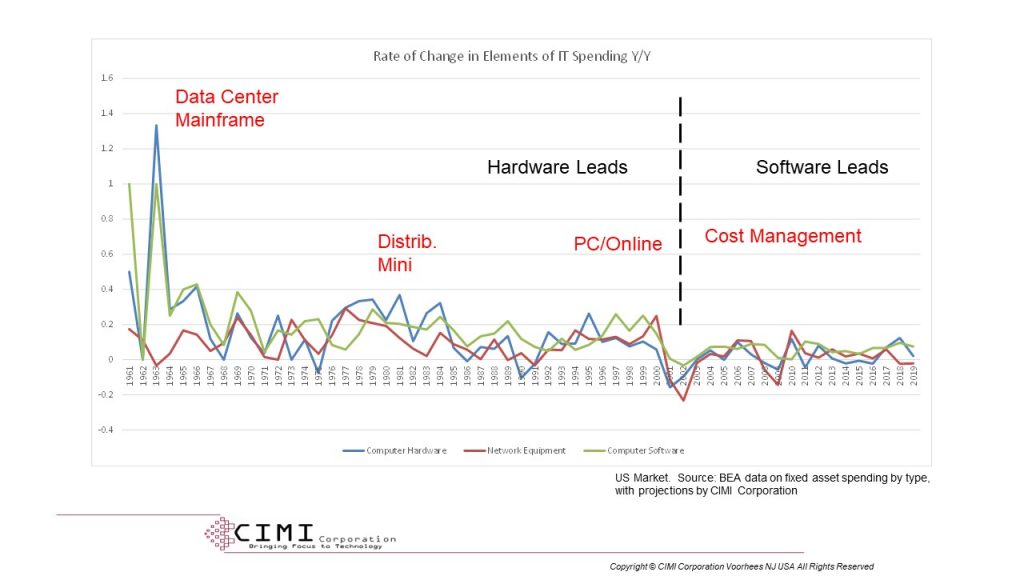
The chart above is a busy one, but important. It shows the rate of change in investment in hardware (computers and peripherals), network equipment, and software spending for the critical period from 1961 when large-scale commercial computing. If you squint and look at the chart, you’ll notice that for the majority of the period, hardware and network investment growth tend to lead software investment growth. That reflects a period when hard resources were the limiting factor in IT empowerment. Starting after the 1999-2000 dot-com crash, though, we see a shift, one where software spending growth leads growth in both hardware and network spending.
Let’s noodle the meaning of the timing shift the chart illustrates. In the period starting around 1977 we saw minicomputer technology explode, increasing hardware investment and lowering the unit computing cost to the point where true online transaction processing was cost-efficient as well as productivity-enhancing. Software spending increased shortly thereafter as applications to exploit the new paradigm developed. In 1994, we saw a boost in hardware spending launched by the personal computer’s adoption. Software applications for the PC exploded in 1997 and beyond, and online Internet applications did the same in 1999-2000, increasing network equipment spending growth.
The dot-com crash caused all IT spending to drop, but it also represented a major shift in thinking to that software-defined era we’re now in. At around 2000, advances in chip technology meant that we had the technology to create more computing power than we had productivity benefits to consume it. There was a sudden stabilization in hardware spending growth, with little change in spending year over year. This coincides with my own survey work’s identification of a sudden change in the source of IT budgets. Prior to 2000, IT budgets tended to come from a mixture of modernization and project sources, with the latter opening new productivity-linked applications. Beyond 2000, there was never again a significant contribution of new productivity-linked applications.
There was still software advance, as the chart shows, but this advance related to the fundamental platform shifts we saw—first virtualization and then cloud computing. Software was building a new framework for hardware to run within. That framework had the initial effect of dampening hardware spending because the new compute paradigm was more resource-efficient. At the very end of the period, 2016-2018, we saw a big jump in hardware spending growth rates, coinciding with the massive build-out of hyperscaler public cloud technology. The dip in 2019 isn’t a dip in spending, but in spending growth; public cloud built out its initial deployment and was now in a process of orderly growth.
The network spending curve also contributes insights here. The shift to IP infrastructure during the 1970s coincided with the rise of OLTP, and the growth period in the 1990s to the shift to IP infrastructure from TDM and POTS. Thereafter, network investment has been roughly aligned with computer and peripheral investment, which suggests that hardware and network are now slaved to software innovation. Absent a new productivity paradigm, the result has been a focus on using software to reduce hardware and network investment. We’ve seen the result of that for years now.
Software is what’s going to change, and the chart above illustrates that software is on approximately a shorter four-to-five-year modernization cycle. That means that the next opportunity for a productivity cycle is likely to come at the point where the next software cycle could begin, which would be approximately 2022-2023.
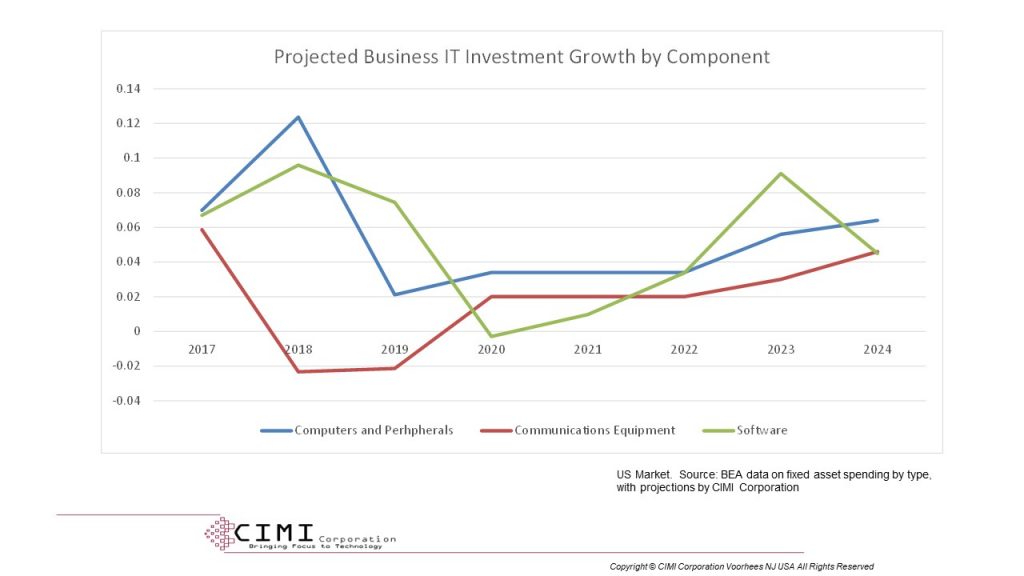
The chart above shows my modeling forecast for the rate of change in IT investment by businesses, in each of the three categories, for the period beyond 2019 up to the limit of current data reliability. The projection shows a significant uptick in software spending, the peak of which is in 2023, and it shows network and IT spending rising in synchrony. This is because a real productivity-driven cycle requires collateral investment in all the elements to deliver empowerment to workers.
In fact, the model shows both IT and network spending increasing faster at the end of my forecast period, showing that the impact of the upcoming cycle is still advancing. If the cycle starts in 2023, then it would be 2027 before it peaks. By 2030 we’d have wound down the cycle, meaning that IT spending would then resume its normal modernization-and-replacement rate.
The question of what might drive the cycle, and even the question of whether anything will drive it, is something that statistics and projections can’t answer. The best that I can do is say when the ingredients are right, but if you look at the earlier figures, you see that we’ve had software peaks in 2007, 2012, and 2018, and none of them kicked off a productivity cycle. There is no objective reason for that, nor for an assumption that 2023 will be one, so we need to look at what’s behind the curves.
The past cycles were launched because of pent-up productivity benefits awaiting resources for realization. We were applying IT to traditional business problems in evolutionary ways, so a cycle was in a sense a resource-driven paradigm. Minis, then PCs, reduced unit cost of empowerment. The problem now isn’t resources, it’s that we’re awaiting a model, an architecture, that links resources to productivity in a new way. A new paradigm, in short. My presumption (or prediction, or guess, or whatever term you’re comfortable with) is that the new paradigm is a continuation of the past trend toward successive cycles that bring computing closer to the worker. As I’ve said in the past, this would make the next step one of point-of-activity empowerment.
Behind this new paradigm is a lot of technology. What you’re trying to do is to construct a virtual world in parallel with the real one the worker, buyer, or seller inhabits. This virtual world can be understood by and manipulated through technology, and it’s anchored to the real world through…you guessed it…the Internet of Things. IoT provides us with the ability to sense the real from the virtual, to locate us and everyone we’re interacting with in both worlds, and to relate positions and relative movements to goals and tactics. Augmented reality provides a window that lets us see the real world through or with the virtual-world overlay.
There are obviously a lot of moving parts to this, but the software needed could be generated easily with today’s tools, particularly cloud and possibly edge computing. The challenge for today is the IoT framework. We need sensors, we need the ability to analyze video to recognize things, and we need a business model that deploys the stuff.
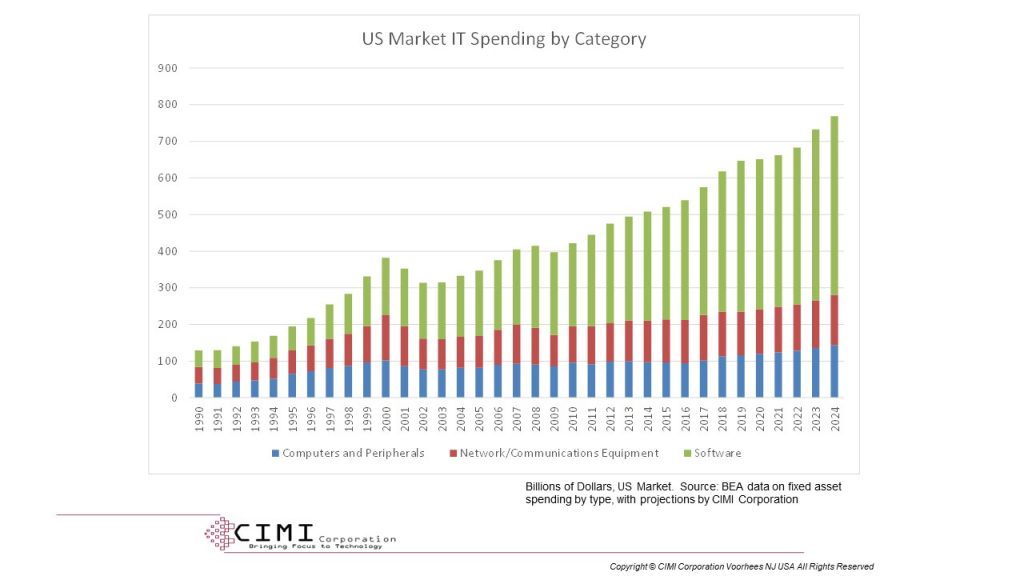
The final chart above shows US market IT spending ($billions, US) in the US by major category, rather than rate of change. It shows (if you look carefully) that we’ve already started to see a climb in computer/peripheral spending from the low in 2016, owing to cloud computing. Network spending is also increasing, though more slowly. My model says that both network and computer spending will accelerate starting in 2023 if the new paradigm arrives.
It’s less likely to arrive, though, if we keep groping pieces of it rather than addressing the whole picture. The new paradigm could validate 5G investment. It could create massive IoT spending, edge computing could become real, and AI and ML could explode. Our mistake is postulating the gains of these technologies in the absence of a driver. The value of computing is created by the combination of hardware, network, and software. We have to get the technologies in all these areas singing the same tune, or we’re going to see stagnation. Who will step forward to make this happen? There is no question that someone will, but the “when” and “who” are still up in the air.